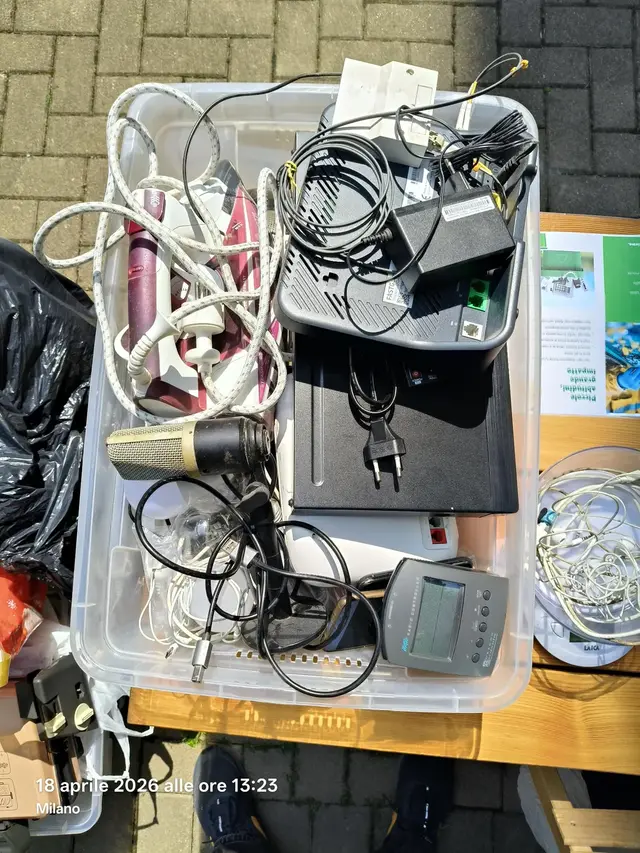
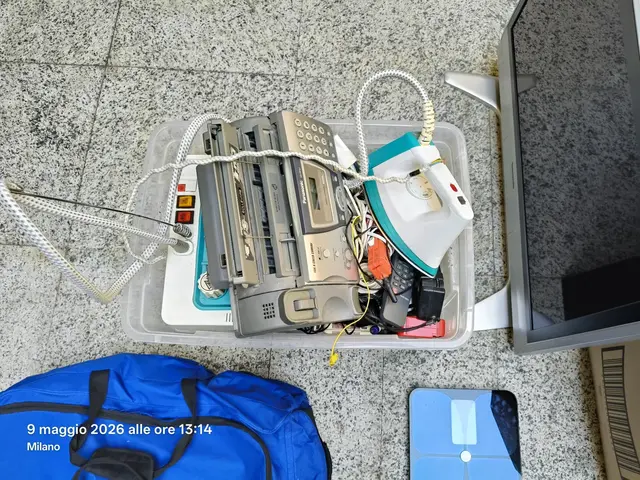
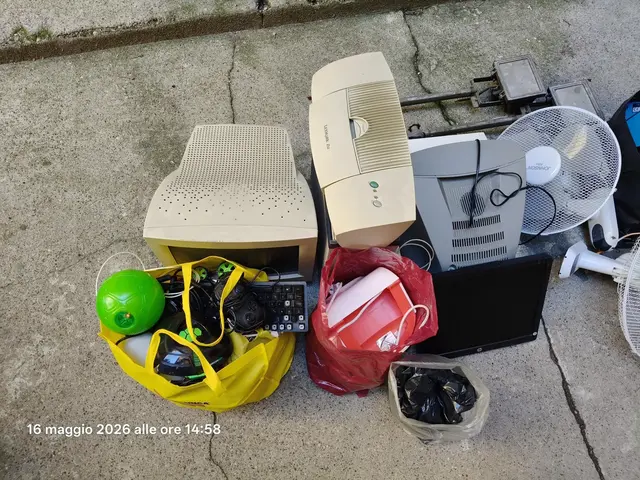
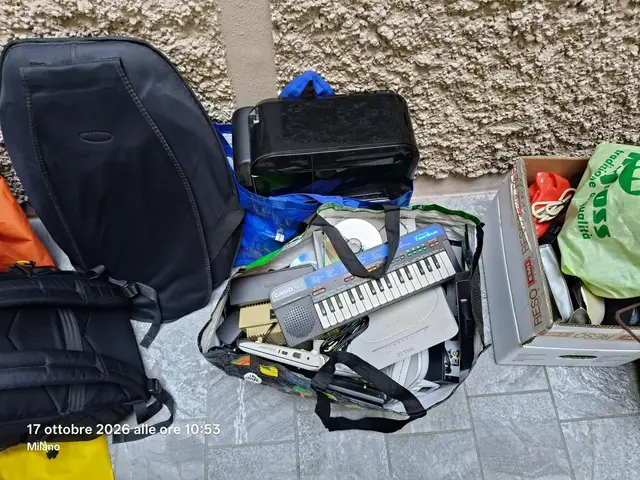
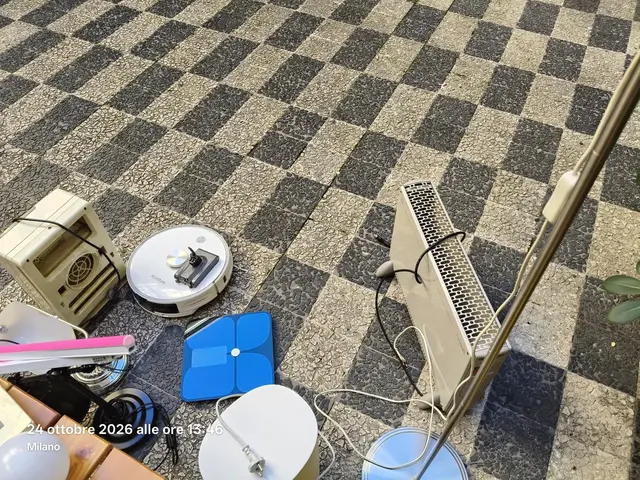
Vanvitelli179.22 kgSpontini170.52 kgBroggi 15100.55 kg
Event 01: Vanvitelli: 179.22 kg (22.6%)Event 02: Plinio 18: 94.35 kg (11.9%)Event 03: Spontini: 170.52 kg (21.5%)Event 04: Plinio 8: 41.21 kg (5.2%)Event 05: Broggi 15: 100.55 kg (12.7%)Event 06: Stoppani 15: 207.90 kg (26.2%)
Plinio 1894.35 kgPlinio 841.21 kgStoppani 15207.90 kg
Vanvitelli179.22 kg
Plinio 1894.35 kg
Spontini170.52 kg
Plinio 841.21 kg
Broggi 15100.55 kg
Stoppani 15207.90 kg
First series
Second series
Source: Original report published on recoserv.eu between May and November 2026, now archived; Internal collection event log. Base: 6 published events. Masses in kg, batteries included. Colour by series.
793.75 kg collected in 6 events
Event
Date
kg
Share
Event 01: Vanvitelli
18 April 2026
179.22
22.6%
Event 02: Plinio 18
9 May 2026
94.35
11.9%
Event 03: Spontini
16 May 2026
170.52
21.5%
Event 04: Plinio 8
10 October 2026
41.21
5.2%
Event 05: Broggi 15
17 October 2026
100.55
12.7%
Event 06: Stoppani 15
24 October 2026
207.90
26.2%
Average participation: 22.2%
18.5%Event 01: Vanvitelli: 10 households of 54 units, 18.5%22.6%Event 02: Plinio 18: 7 households of 31 units, 22.6%37.7%Event 03: Spontini: 20 households of 53 units, 37.7%15.8%Event 04: Plinio 8: 3 households of 19 units, 15.8%25.5%Event 05: Broggi 15: 13 households of 51 units, 25.5%11.9%Event 06: Stoppani 15: 8 households of 67 units, 11.9%Mean 22.2%
Mean 22.2%18.5%Event 01: Vanvitelli: 10 households of 54 units, 18.5%22.6%Event 02: Plinio 18: 7 households of 31 units, 22.6%37.7%Event 03: Spontini: 20 households of 53 units, 37.7%15.8%Event 04: Plinio 8: 3 households of 19 units, 15.8%25.5%Event 05: Broggi 15: 13 households of 51 units, 25.5%11.9%Event 06: Stoppani 15: 8 households of 67 units, 11.9%
Source: Original report published on recoserv.eu between May and November 2026, now archived; Internal collection event log. Base: 6 published events. Overall mean: 61 households of 275 units.
Average participation: 22.2%
Event
Households / units
Participation
Event 01: Vanvitelli
10 / 54
18.5%
Event 02: Plinio 18
7 / 31
22.6%
Event 03: Spontini
20 / 53
37.7%
Event 04: Plinio 8
3 / 19
15.8%
Event 05: Broggi 15
13 / 51
25.5%
Event 06: Stoppani 15
8 / 67
11.9%
Overall mean
61 / 275
22.2%
Each event took place in a different building: the differences do not measure an improvement over time.
Event comparison
Event
Date
kg
Households / units
Participation
Event 01: Vanvitelli
18 April 2026
179.22
10 / 54
18.5%
Event 02: Plinio 18
9 May 2026
94.35
7 / 31
22.6%
Event 03: Spontini
16 May 2026
170.52
20 / 53
37.7%
Event 04: Plinio 8
10 October 2026
41.21
3 / 19
15.8%
Event 05: Broggi 15
17 October 2026
100.55
13 / 51
25.5%
Event 06: Stoppani 15
24 October 2026
207.90
8 / 67
11.9%
Aggregate
2026
793.75
61 / 275
22.2%
Participation is calculable for 6 of 6 events.
Aggregate categories
Small appliances and electronics (R4) is the most collected category
Every 100 kg collected
57.5 kg per 100Small appliances and electronics (R4)Small appliances and electronics (R4): 456.41 kg
26.5 kg per 100TVs and screens (R3)TVs and screens (R3): 210.30 kg
13.9 kg per 100Fridges and air conditioners (R1)Fridges and air conditioners (R1): 109.95 kg
1.4 kg per 100Batteriesnot an R categoryBatteries: 11.196 kg
0.7 kg per 100Light bulbs and light sources (R5)Light bulbs and light sources (R5): 5.81 kg
Source: Original report published on recoserv.eu between May and November 2026, now archived; Internal collection event log. Base: 6 published events. Shares of the sum of the items shown (793.67 kg).
Small appliances and electronics (R4) is the most collected category
Item
kg
kg per 100
Small appliances and electronics (R4)
456.41
57.5
TVs and screens (R3)
210.30
26.5
Fridges and air conditioners (R1)
109.95
13.9
Batteries
11.196
1.4
Light bulbs and light sources (R5)
5.81
0.7
Batteries follow a separate system (CDCNPA) and do not fall within WEEE categories R1-R5. Published events only.
Reading the data
Participation rate
Participating households divided by residential units. The aggregate rate uses only events with both values known. It does not measure an ongoing service.
R4 and R5 categories
R4: 456.41 kg; R5: 5.81 kg. Scope: published events and reported categories only.
Observed and estimated
Reported data has not been independently verified. No environmental or economic estimate is presented as a result.
Methodology and limitations
The events are manual condominium collections, not smart-bin installations.
Each event concerns one building; size and composition may differ.
Results cannot be generalised and the comparison is not drawn from a controlled experiment.
Values are reported from the stated sources, without independent verification. Batteries are recorded separately, with the total scope stated.
For events where the tracking sheet records individual contributors, participating households correspond to distinct contributors.
Original report published on recoserv.eu between May and November 2026, now archived